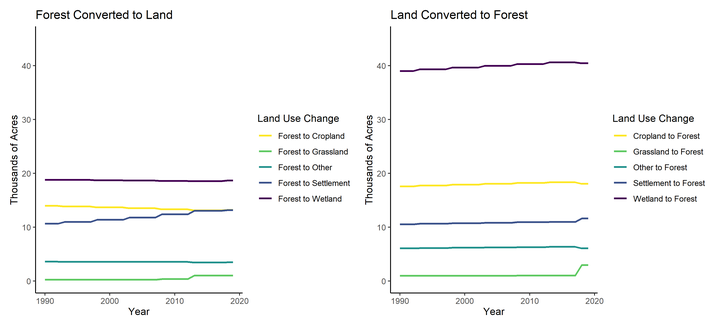
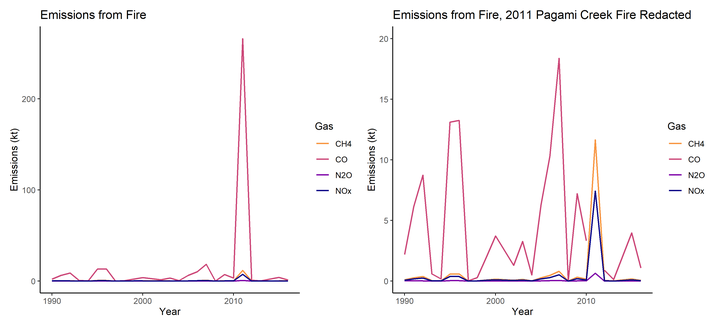
Key figures produced using data from "Greenhous gas emissions and removals from forest land, woodlands, and urban trees in the United States, 1990 - 2019." These data have been filtered to select only data from the state of Minnesota.
Data Source
Domke, Grant M.; Walters, Brian F.; Nowak, David J.; Smith, James, E.; Nichols, Michael C.; Ogle, Stephen M.; Coulston, J.W.; Wirth, T.C. 2021. Greenhouse gas emissions and removals from forest land, woodlands, and urban trees in the United States, 1990-2019. Resource Update FS-307. Madison, WI: U.S. Department of Agriculture, Forest Service, Northern Research Station. https://doi.org/10.2737/FS-RU-307.